
Chapter 8 - Water Quality Parameter
- Komal Bhardwaj
- May 20, 2025
- 18 min read
Multidisciplinary Approach: Enhanced Agriculture Production in a Sustainable way


Indeed, water is a vital component for the survival of all living beings, and its contamination can have severe consequences. The contamination of water bodies by hazardous substances resulting from modernization, industrialization, and technological-based farming practices can harm not only humans but also other species. Water is a valuable natural resource that must be kept secure and of high quality for consumption by humans and aquatic life [1,3]. Parameters for measuring water quality are tools for figuring out the physical, chemical, and biological properties of water. These factors aid in evaluating the general water quality and determining if it is good for usage like drinking, swimming, irrigation, or industrial applications. In order to find any potential contaminants or pollution sources that could have an impact on the water quality, it is crucial to monitor certain water quality measures. The information gathered from water quality monitoring programmes can be used to create management plans and guidelines that will safeguard and enhance the quality of the water. In general, assuring the availability of clean water requires a grasp of water quality factors [2, 15]. Water quality parameters that can be used to assess the physical, chemical, and biological characteristics of water are physical parameter, chemical parameters, biological parameters, radiological parameters, toxicological parameters, and flow parameters [3,4] (Figure1).

1. Physical parameter
Physical parameters are important for assessing water quality because they provide information about the physical characteristics of water that can impact its suitability for different uses [4]. Here are some reasons why physical parameters are important:
Aesthetics: Physical parameters such as color, odor, and taste can impact the aesthetic quality of water. Aquatic Life: Physical parameters such as temperature, dissolved oxygen, and turbidity can affect the health and survival of aquatic life.
Drinking Water: Physical parameters such as turbidity, taste, and odor can indicate the presence of contaminants that may impact the safety and taste of drinking water.
Industrial Use: Physical parameters such as electrical conductivity can impact the suitability of water for different industrial uses. Water with high electrical conductivity may be more corrosive and affect the performance of industrial equipment [3,5].

Turbidity- Turbidity is a measure of the cloudiness or haziness of a liquid caused by the presence of suspended particles. The instrument used to measure turbidity is called a nephelometric turbid meter, which measures the amount of light scattered by suspended particles in the water. Turbidity is typically expressed in nephelometric turbidity units (NTU) or turbidity units (TU). One TU is equivalent to the amount of suspended silica that would produce a turbidity of 1 NTU. A higher turbidity value indicates a greater number of suspended particles in the water [5,6,7]. Groundwater typically has very low turbidity levels because it is naturally filtered as it moves through the soil. However, human activities such as construction, agriculture, and mining can increase turbidity levels in groundwater by introducing suspended particles into the water. Turbidity can also reduce the effectiveness of water treatment processes by interfering with disinfection and filtration processes [8,9].
Temperature- Temperature is an important physical parameter used to assess water quality because it can impact the health and survival of aquatic life, the growth of aquatic plants, and the effectiveness of water treatment processes [2]. Temperature is typically measured in degrees Celsius (°C) or Fahrenheit (°F). Aquatic organisms are adapted to live within specific temperature ranges, and changes in water temperature can have a variety of impacts on their health and survival. For example, warm water can hold less dissolved oxygen than cold water, which can cause oxygen depletion and negatively impact aquatic organisms such as fish. High water temperatures can also increase the growth of harmful algae and bacteria, leading to water quality issues [2,10]. In addition, temperature can impact the effectiveness of water treatment processes. Changes in water temperature can affect the rate of chemical reactions, including disinfection processes, which can impact the quality of drinking water. Temperature influences solvability, odours, palatability, and chemical reactions [4,11].
Taste and Odour- Taste refers to the flavor or perceived sensation of a substance in the mouth, while odour refers to the smell or perceived sensation of a substance in the nose [2,11]. Water that has an unpleasant taste or odour may be unpalatable, and may also indicate the presence of contaminants such as algae, bacteria, or organic matter. The most common taste and odour problems in water are caused by compounds such as geosmin and 2-methylisoborneol (MIB), which are produced by certain types of algae and bacteria. Taste and odour are often evaluated subjectively by human sensory panels, but can also be measured using analytical techniques such as gas chromatography and mass spectrometry [12,13]. Taste and odor in water can come from a variety of sources, including natural and man-made sources. Some of the most common sources of taste and odor in water includes algae,bacteria, chemicals, organic matter, industrial and agricultural pollution[12,14].
Electrical conductivity (EC)- Electrical conductivity (EC) is a commonly used parameter for water quality analysis. It is a measure of the ability of water to conduct electrical current and is expressed in units of Siemens per meter (S/m). EC is influenced by the dissolved ionic content in water, which includes salts such as calcium, magnesium, sodium, and chloride, as well as other dissolved substances like acids and bases [4]. High EC values indicate high TDS content, which can affect the taste and palatability of water. EC can also be used as an indicator of water pollution. Certain pollutants, such as heavy metals and organic compounds, can increase the conductivity of water. Therefore, an increase in EC levels may indicate the presence of pollution and prompt further investigation and remediation [4,11].
Solids- Total solids (TS) refer to the total amount of solids, both dissolved and suspended, present in water, while dissolved solids refer specifically to the number of solids that are dissolved in the water. High levels of total solids or dissolved solids can indicate pollution or contamination in water sources. Additionally, source control measures, such as reducing agricultural runoff and properly disposing of industrial waste, can help prevent the introduction of solids into water sources in the first place. The water sample is passed through a glass fiber filter, which can be used to identify these two kinds of solids. The suspended solids are retained on the top of the filter and the dissolved solids pass through the filter with the water. If the filtered portion of the water sample is placed in a small dish and then evaporated, the solids as a residue [2,4,14]. This material is usually called total dissolved solids or TDS. Total dissolved solids are a measure of the amount of dissolved inorganic and organic substances present in water. They are calculated as follows:

Based on the TDS concentration, water can be classified into three broad categories:
a) Freshwater: Freshwater contains a low concentration of TDS, typically less than 1500 mg/L. This includes most surface and groundwater sources and is suitable for human consumption and agricultural purposes.
b) Brackish Water: Brackish water contains a moderate concentration of TDS, typically ranging from 1500 to 5000 mg/L. It is often found in coastal areas, estuaries, and some inland sources, and may require desalination or treatment for certain uses.
c) Saline Water: Saline water contains a high concentration of TDS, typically greater than 5000 mg/L. This includes seawater, some underground aquifers, and other highly concentrated sources [2,4].
1. Chemical Parameters
Chemical parameters are important indicators of water quality because they provide information about the presence and concentration of various chemical substances in water that can impact both human health and the environment. Some of the most important chemical parameters for water quality include:
pH- pH is a commonly measured water quality parameter that indicates the acidity or alkalinity of a solution. The pH scale ranges from 0 to 14, where 7 being neutral, below 7 and above 7 indicating acidity and alkalinity respectively. In general, most aquatic organisms prefer a pH range of 6.5 to 8.5[1,16,17]. However, the preferred pH range can vary widely depending on the specific species of organism. For example, some species of fish may prefer a pH range closer to 7.0, while others may prefer a more alkaline pH (Figure3). The pH of water can be influenced by a variety of factors, including natural processes such as weathering and the decomposition of organic matter, as well as human activities such as acid rain deposition, industrial discharges, and wastewater treatment [18]. Changes in pH can have significant impacts on the chemistry of aquatic systems, including nutrient availability, metal toxicity, and the solubility of minerals [4,14].

Acidity- Acidity is an important water quality parameter that measures the amount of acid in water. It is typically measured as pH, which is a measure of the concentration of hydrogen ions in the water. The acidity of water is a measure of its ability to neutralize bases and can be caused by a variety of factors, including the presence of mineral acids, hydrolyzed salts, and dissolved carbon dioxide. Carbon dioxide (CO2) is one of the most common sources of acidity in water, and when dissolved in water, carbon dioxide reacts with water molecules to form carbonic acid (H2CO3), which can lower the pH of the water and increase its acidity. To measure the acidity of water, a standard titration method is typically used [4]. This involves adding a known amount of sodium hydroxide (NaOH) to a water sample until the acidity is neutralized, as indicated by a change in color of the phenolphthalein indicator. [2,12].
Alkalinity- Alkalinity is a measure of the water's buffering capacity, or its ability to resist changes in pH when acids or bases are added to it. Alkalinity is the sum of components in the water that tend to elevate the pH to the alkaline side of neutrality. It is measured by titration with standardized acid to a pH value of 4.5 and is expressed commonly as milligrams per litre as calcium carbonate (mg/L as CaCO3). The acceptable range of alkalinity in water varies depending on the intended use of the water. In general, drinking water should have an alkalinity level between 20 and 200 mg/L. Alkalinity levels above this range may indicate the presence of excessive amounts of dissolved minerals such as calcium, magnesium, or bicarbonates, which can lead to scaling or other issues in water treatment systems or plumbing [2,4,14].
Chloride- Chloride is an important water quality parameter that measures the amount of dissolved chloride ions in water. Chloride can enter water from natural sources such as rocks and soil, as well as from human activities such as road salt application, wastewater discharges, and industrial processes [2,4]. Chloride concentration is typically measured in milligrams per liter (mg/L) or parts per million (ppm). The acceptable level of chloride in drinking water is set at 250 mg/L by the World Health Organization (WHO), although the level can vary depending on the source of the water and the intended use. High levels of chloride in water can have negative impacts on aquatic life, particularly freshwater fish and other aquatic organisms, by affecting the water's salinity and osmotic balance [18,19].
Chlorine residual- Chlorine residual is an important water quality parameter that measures the concentration of chlorine remaining in water after disinfection [2]. Chlorine residual is measured in terms of the concentration of free chlorine, which is the portion of chlorine that remains unreacted after disinfection. The presence of free chlorine residual indicates that the water has been adequately disinfected and is safe for consumption [4]. Chlorine residual levels are typically monitored at various points in the water treatment and distribution system, including at the treatment plant, in storage tanks, and in the distribution network. The required chlorine residual levels vary depending on the type of water system and regulatory requirements, but generally fall within the range of 0.2 to 2.0 mg/L [10,11].
Sulphate- Sulphates ions (SO4 2-) can come from natural sources such as minerals in the earth's crust, as well as human activities such as mining, agriculture, and industrial processes [4]. In high concentrations, sulphate can have adverse effects on water quality and human health. It can cause gastrointestinal problems, such as diarrhoea, in people who are sensitive to it. Sulphate can also contribute to the corrosion of pipes and plumbing fixtures and cause scaling in water heaters and boilers [2,3]. Sulphate can combine with other chemicals in the water to form sulphides, which are toxic to many aquatic species. The recommended sulphate concentration in drinking water by the World Health Organization (WHO) is less than 250 mg/L [8,10]
Nitrogen- Nitrogen indicates the level of pollution and potential for eutrophication in bodies of water. Several forms of nitrogen that are commonly measured in water quality analysis are: ammonia (NH3-N), nitrate (NO3-N) and nitrite (NO2-N) [2,4,5]. The presence of nitrogen in excess amounts can lead to eutrophication, a process where an excessive amount of nutrients in water causes rapid growth of algae and other aquatic plants [11,14].
Fluoride- Fluoride (F-) can occur naturally in some groundwater sources, but it can also be added to drinking water in some areas to prevent tooth decay [2]. However, high fluoride content in drinking water can cause dental fluorosis and skeletal in some individuals. The World Health Organization says that fluoride levels in drinking water should be between 0.5 and 1.5 mg/L [4]. Fluoride levels higher than 1.5 mg/L can be bad for people's health. As a result, it is necessary to keep an eye on the fluoride content of drinking water to ensure that it stays within acceptable limits [10,14].
Iron and manganese- Iron and manganese are common parameters used to assess the quality of water, especially in groundwater. These metals occur naturally in the environment and can dissolve into groundwater sources. When present in high concentrations, they can cause water to have an unpleasant taste, odor, and appearance. They can also stain clothing and fixtures and cause damage to pipes and appliances. The maximum contaminant level (MCL) set by the United States Environmental Protection Agency (EPA) for iron is 0.3 milligrams per liter (mg/L), while the MCL for manganese is 0.05 mg/L [4,5].
Copper and zinc- Copper can be present in water due to corrosion of copper pipes or from agricultural and industrial activities. High concentration of copper in drinking water can cause gastrointestinal distress and liver or kidney damage over time [4]. The Environmental Protection Agency (EPA) has set the maximum contaminant level (MCL) for copper in drinking water at 1.3 milligrams per liter (mg/L). Zinc is often found in industrial wastewater, stormwater runoff, and sewage effluent. High levels of zinc in drinking water can cause gastrointestinal distress, anemia, and other health problems. The EPA has set the MCL for zinc in drinking water at 5 mg/L [18,19].
Hardness- Hardness measures the concentration of dissolved calcium and magnesium ions in water. Calcium and magnesium are naturally occurring minerals that are commonly found in water sources. Hardness is expressed in terms of milligrams of calcium carbonate per litre of water (mg/L or ppm) [4,5]. There are two types of hardness: temporary hardness and permanent hardness.
a) Temporary hardness: Temporary hardness is caused by the presence of dissolved calcium and magnesium bicarbonate in water. This type of hardness can be reduced by boiling the water, which causes the bicarbonate to decompose into carbonate and water, releasing carbon dioxide.
b) Permanent hardness: Permanent hardness is caused by the presence of dissolved calcium and magnesium sulphates and chlorides in water. This type of hardness cannot be reduced by boiling the water and requires other methods of treatment, such as ion exchange or reverse osmosis [10,21].
The hardness of water varies depending on the location and source of the water. Calcium (Ca2+) and magnesium (Mg2+) ions cause the greatest portion of hardness in naturally occurring waters. These ions are present as bicarbonates, sulphates, and sometimes as chlorides and nitrates [11].
Table1: Water Classification according to its hardness [4].
Water category | Total hardness concentration as mg/L as CaCO3 |
Soft water | <50 mg/L |
Moderately hard water | 50–150 mg/L |
Hard water | 150–300 mg/L |
Very hard | >300 mg/L |
Dissolved oxygen- Dissolved oxygen (DO) is a critical water quality parameter that measures the amount of oxygen dissolved in water. DO is essential for the survival of aquatic organisms, as it is necessary for the respiration and metabolic processes of fish, invertebrates, and other aquatic life [3]. DO levels in water can be affected by a variety of factors, including temperature, pressure, atmospheric oxygen levels, and the presence of photosynthetic organisms such as algae. The ideal DO level for most aquatic life is between 5 and 9 mg/L, although some species may require higher or lower levels. DO levels that fall below 3 mg/L can be stressful or even lethal to some aquatic organisms, while levels above 12 mg/L can also be harmful [10,14]. DO levels can be affected by pollution and other human activities that impact water quality, such as nutrient runoff and organic matter decomposition. When organic matter decomposes in water, it consumes DO, leading to lower levels and potentially harmful conditions for aquatic life. Water treatment facilities also monitor DO levels to ensure that the water is properly aerated and that sufficient DO levels are maintained throughout the treatment process [10,21].
Biochemical oxygen demand (BOD)- Biochemical oxygen demand (BOD) is a measure of the amount of dissolved oxygen that is consumed by microorganisms in water while they decompose organic matter under aerobic (oxygen-requiring) conditions [2,4]. BOD is typically used as an indicator of the organic pollution level of water, as higher levels of organic matter in water require more oxygen for decomposition, which can lead to oxygen depletion and negatively impact aquatic life. The difference between the initial and final dissolved oxygen levels represents the amount of oxygen consumed during the incubation period and is used to calculate the BOD value of the water sample. BOD values are expressed in milligrams of oxygen per liter of water (mg/L) and can range from very low (less than 1 mg/L) in pristine waters to very high (over 30 mg/L) in heavily polluted waters [20,21]. This means that BOD provides a quantitative assessment of the level of pollution in water and can be used to compare the quality of water from different sources or at different times. BOD is often used in conjunction with other water quality parameters, such as dissolved oxygen, pH, and nutrient levels, to develop a comprehensive picture of water quality [22, 23].
BOD curve- The BOD curve is a graph that shows the relationship between dissolved oxygen (DO) concentration and time during a BOD test. The BOD curve is an important tool for assessing water quality, as it provides information about the level of organic pollution in water and the rate at which microorganisms are decomposing organic matter. The BOD curve typically consists of two phases: an initial oxygen demand phase and a stabilization phase. During the initial oxygen demand phase, the concentration of DO in the water sample decreases rapidly as microorganisms consume oxygen while decomposing organic matter. This phase can last from a few hours to a few days, depending on the amount and type of organic matter present in the water. After the initial oxygen demand phase, the DO concentration in the water sample stabilizes as the rate of oxygen consumption by microorganisms slows down [2,3,4]. This stabilization phase can last from a few days to a few weeks, depending on the duration of the BOD test. The shape of the BOD curve can provide valuable information about the nature and extent of organic pollution in water. For example, a steep initial oxygen demand phase followed by a gradual stabilization phase may indicate the presence of easily biodegradable organic matter, while a slower initial oxygen demand phase followed by a prolonged stabilization phase may indicate the presence of more recalcitrant organic matter [24,25]. BOD curve is expressed mathematically by the following equation:
BODt = BODL × (1 − 10−kt)
Where BODt = BOD at any time t (mg/L);
BODL = ultimate BOD (mg/L);
k = a constant representing the rate of the BOD reaction
t = time

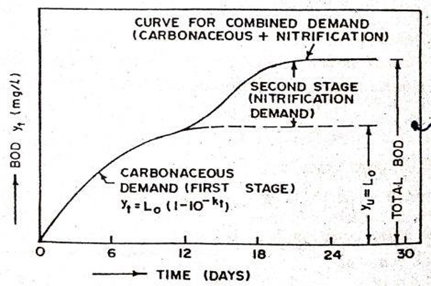

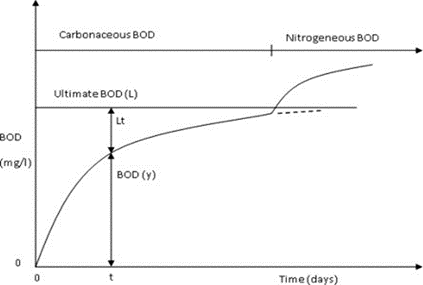
Figure 4: BOD curve
Chemical oxygen demand (COD)- Chemical oxygen demand (COD) measures the amount of organic and inorganic pollutants present in water. Unlike BOD, which only measures the amount of oxygen consumed by microorganisms during the decomposition of organic matter, COD measures the total amount of oxygen required to oxidize all organic and inorganic substances in water. COD is a useful parameter for assessing the effectiveness of wastewater treatment facilities and for determining the potential for oxygen depletion in water bodies [3]. High levels of COD can indicate the presence of pollutants such as organic chemicals, pesticides, and industrial effluents, which can negatively impact the health of aquatic ecosystems [26]. The amount of oxygen consumed during the oxidation process is then measured and used to calculate the COD value of the water sample. COD values are expressed in milligrams of oxygen per liter of water (mg/L) [27,28,29].
3. Toxic Substances
Water sources can become contaminated with toxic substances through various means, including industrial activities, agricultural runoff, sewage discharge, and improper disposal of hazardous materials [2]. There are many types of toxic substances that can be considered as water quality parameters. Here are some examples:
a) Heavy metals: Heavy metals such as lead, mercury, arsenic, cadmium, and chromium are commonly measured as water quality parameters.
b) Pesticides and herbicides: Pesticides and herbicides are toxic substances that are commonly used in agricultural practices.
c) Polychlorinated biphenyls (PCBs): PCBs are synthetic organic compounds that were widely used in industrial applications before being banned in the 1970s.
d) Chlorinated solvents: Chlorinated solvents such as trichloroethylene (TCE) and perchloroethylene (PCE) are toxic substances that can be found in water sources near industrial sites where they were used as degreasers and cleaning agents.
e) Pharmaceuticals and personal care products (PPCPs): PPCPs are a broad category of substances that include prescription and over-the-counter drugs, as well as personal care products such as soaps and shampoos.
f) Microplastics: Microplastics are small plastic particles that can enter water sources through various means such as plastic waste, synthetic fibers from clothing, and personal care products. [5,11,16].
4. Radioactive substances
Radioactive substances can enter water sources through various means, including natural processes such as decay of radioactive elements in the earth's crust, or human activities such as nuclear power generation, mining, and nuclear weapon testing. Some common radioactive substances found in water sources include: Radon, Uranium, Radium, Tritium are radioactive elements that can be found in natural water sources [3,4,30]. Exposure to high levels of these elements can increase the risk of kidney damage, cancer and other health problems Some common treatment methods for radioactive substances in water includes reverse osmosis, ion exchange, precipitation and activated carbon filtration [5,30].
5. Biological Parameter
Biological water quality parameters are used to evaluate the presence and abundance of living organisms in water bodies [4]. These parameters provide an assessment of the overall health of the aquatic ecosystem and can also indicate the potential for waterborne diseases.
Bacteria- Bacteria are a key water quality parameter that can indicate the presence of harmful pathogens and contamination in water sources. Coliform bacteria in water sources can indicate contamination by fecal matter and the potential presence of harmful pathogens. E. coli is a type of coliform bacteria that is commonly used as an indicator of fecal contamination in water sources. Legionella pneumophila is a type of bacteria that can cause Legionnaires' disease, a potentially fatal form of pneumonia that is transmitted through contaminated water. Vibrio cholerae cause cholera, a potentially fatal disease that is transmitted through contaminated water [32,34].
Algae- Algae are microscopic plants that can grow in aquatic environments. While algae can be beneficial to aquatic ecosystems, excessive growth of certain types of algae can indicate nutrient pollution and potential harmful effects on aquatic life. Water quality monitoring programs often include testing for algae to assess the health of aquatic ecosystems and the potential impact of nutrient pollution on water sources. The presence of excessive algae growth can be mitigated through nutrient reduction strategies such as limiting fertilizer use, reducing nutrient discharges from wastewater treatment plants and other sources, and promoting better land use practices to reduce erosion and runoff [4,31].
Protozoa- Protozoa are single-celled organisms that are commonly used as water quality parameters. They are often indicators of fecal contamination and can be used to assess the risk of waterborne diseases. Giardia and Cryptosporidium is a parasitic protozoan that can cause gastrointestinal illness in humans and animals. Like Giardia, monitoring levels of Cryptosporidium in water can indicate the risk of waterborne disease outbreaks [2,4, 33].

Viruses- Viruses cause a range of illnesses in humans and animals and can be transmitted through waterborne routes. Enteroviruses are a group of viruses that are commonly found in fecally contaminated water. They can cause a range of illnesses, including gastroenteritis and meningitis. Hepatitis A virus is a virus that can be transmitted through contaminated water and can cause liver disease [2,5,34].
Conclusion
In conclusion, water quality parameters are measurements used to assess the physical, chemical, biological, and radiological characteristics of water. There are numerous water quality parameters, including pH, turbidity, dissolved oxygen, total dissolved solids, nutrients, heavy metals, bacteria, viruses, algae, protozoa, and radioactive substances. Each of these parameters can have a significant impact on water quality and can be used to identify potential sources of contamination and to develop strategies for protecting water resources. Regular monitoring of water quality parameters is critical in maintaining the safety and sustainability of water resources. It allows for early detection of changes in water quality and provides important information for decision-making related to water management and public health. Through continuous monitoring and management, we can ensure that our water resources remain clean, safe, and available for future generations.
References
1. Alley ER. Water Quality Control Handbook. Vol. 2. New York: McGraw-Hill; 2007.
2. APHA. Standard Methods for the Examination of Water and Wastewater. 21st ed. Washington, DC: American Public Health Association; 2005.
3. Shah C. Which Physical, Chemical and Biological Parameters of Water Determine Its Quality?; 2017.
4. Hassan Omer N. Water Quality Parameter, IntechOpen; 2020.
5. Gray NF. Drinking Water Quality: Problems and Solutions. 2nd ed. Cambridge: Cambridge University Press; 2008.
6. Pradeep, V., Deepika, C., Urvi, G., & Hitesh, S. (2012). Water Quality Analysis of an Organically Polluted Lake by Investigating Different Physical and Chemical Parameters. International Journal of Research in Chemistry and Environment, 2, 105–111.
7. M. -m. Chen, T. -c. Wang, X. -l. Xiong and Z. -x. Xie, "Definitions and measurements of physical parameters of objective world apperceived by Human vision," 2013 6th International Congress on Image and Signal Processing (CISP), Hangzhou, China, 2013, pp. 846-851.
8. Davies-Colley, R. J., & Smith, D. G. (2001). Turbidity Suspended Sediment, And Water Clarity: A Review1. Journal of the American Water Resources Association, 37(5), 1085– 1101.
9. Meiburg, E., & Kneller, B. (2009). Turbidity Currents and Their Deposits.
Https://Doi.Org/10.1146/Annurev-Fluid-121108-145618, 42, 135–156.
10. Davis ML. Water and Wastewater Engineering—Design Principles and Practice. New York: McGraw-Hill; 2010.
11. Tchobanoglous G, Peavy HS, Rowe DR. Environmental Engineering. New York: McGraw-Hill Interamericana; 1985.
12. Tomar M. Quality Assessment of Water and Wastewater. Boca Raton: CRC Press; 1999
13. DeZuane J. Handbook of Drinking Water Quality. 2nd ed. New York: John Wiley & Sons; 1997.
14. Tchobanoglous G, Burton FL, Stensel HD. Metcalf & Eddy Wastewater Engineering: Treatment and Reuse. 4th ed. New Delhi: Tata McGraw-Hill Limited; 2003.
15. Edzwald JK. Water Quality and Treatment a Handbook on Drinking Water. New York: McGraw-Hill; 2010.
16. Spellman FR. The Drinking Water Handbook. 3rd ed. Boca Raton: CRC Press; 2017.
17. Hammer MJ. Water and Wastewater Technology. 7th ed. Upper Saddle River: Pearson education; 2011.
18. World Health Organization Guidelines for drinking-water quality. 4th ed. Geneva: WHO; 2011.
19. Chatterjee A. Water Supply Waste Disposal and Environmental Pollution Engineering (Including Odour, Noise and Air Pollution and its Control). 7th ed. Delhi: Khanna Publishers; 2001.
20. Hassan, K., Multafu, E., & Arhyel, Y. (2020). Assessment Of Some Physicochemical Parameters of Gubi and Waya Reservoir In Bauchi State, Nigeria. International Journal of Scientific & Technology Research, 9, 2.
21. DeZuane J. Handbook of Drinking Water Quality. 2nd ed. New York: John Wiley & Sons; 1997.
22. McGhee T J, Steel EW. Water Supply and Sewerage. New York: McGraw-Hill; 1991.
23. Banerjee, D., Chatterjee, S., & Nath, S. (2022). Aquatic Physicochemical Parameters and Their Possible Impact on Freshwater Bodies. Applied Ecology and Environmental Sciences, Vol. 10, 2022, Pages 360-367, 10(6), 360–367.
24. Lee, J., Lee, S., Yu, S., & Rhew, D. (2016). Relationships between water quality parameters in rivers and lakes: BOD5, COD, NBOPs, and TOC. Environmental Monitoring and Assessment, 188(4), 1–8.
25. Gorde, S. P., & Jadhav, M. V. (n.d.). Assessment of Water Quality Parameters: A Review. Journal of Engineering Research and Applications, 3, 2029. Retrieved April 16, 2023.
26. M, Q. U., & HA, S. (2015). Physico-chemical Parameters of Water in Bibi Lake, Ahmedabad, Gujarat, India. Journal of Pollution Effects & Control, 3(2), 1–5.
27. B. N. Tandel, Dr. J. Macwan and C. K. Soni - "Assessment of Water Quality Index of Small Lake in South Gujarat Region, India."
28. Carbajal-Palacios, Patricia & Balderas-Hernández, Patricia & Ibanez, Jorge & Roa- Morales, Gabriela. (2015). Downscaling the chemical oxygen demand test.
29. M.S. Kamath, The COD design curve: An assessment of validity using wide plate tests, International Journal of Pressure Vessels and Piping, Volume 9, Issue 2, 1981, Pages 79- 105, ISSN 0308-0161.
30. Skeppström K, Olofsson B. Uranium and radon in groundwater. European Water. 2007;17:51-62.
31. Gökçe, D., & Gökçe, D. (2016). Algae as an Indicator of Water Quality. Algae - Organisms for Imminent Biotechnology. https://doi.org/10.5772/62916.
32. Omar, W. M. W. (2010). Perspectives on the Use of Algae as Biological Indicators for Monitoring and Protecting Aquatic Environments, with Special Reference to Malaysian Freshwater Ecosystems. Tropical Life Sciences Research, 21(2), 51.
33. Wiesmann U, Choi IS, Dombrowski E-M. Fundamentals of Biological Wastewater Treatment. Darmstadt: John Wiley & Sons; 2007.
34. Mara D, Horan NJ. Handbook of Water and Wastewater Microbiology. London: Elsevier; 2003.